Pfeiffer University’s Teacher Education Department is accredited by the Council on the Accreditation of Educator Preparation (CAEP) for programs in the following areas: INITIAL: Elementary; Special Education: General Curriculum; Health and Physical Education; Comprehensive Science 9-12; Comprehensive Social Studies 9-12; English 9-12; Mathematics 9-12; and Music (general).
IMPACT MEASURES
Measure 1: Completer Effectiveness (R.4.1)
| 1.1. Completer Impact on P-12 Learning and Development |
|---|
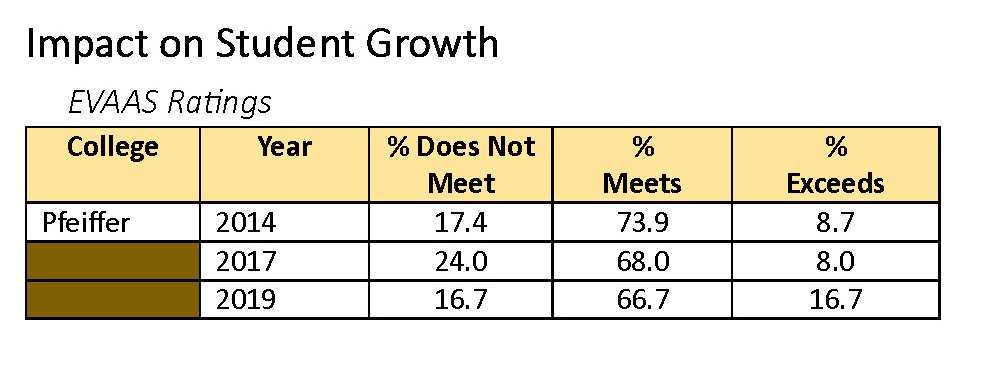
| The North Carolina Department of Public Instruction collects data through the NC Educator Evaluation System for beginning teachers prepared by approved teacher education programs in the state. These EVAAS data are reported on the NCDPI EPP Dashboard annually. (CAEP Reporting Data – for website – 2022-2023) |

| 1.2. Completer Indicators of Teaching Effectiveness (Effectiveness in Applying Professional Knowledge, Skills, and Dispositions) |
|---|
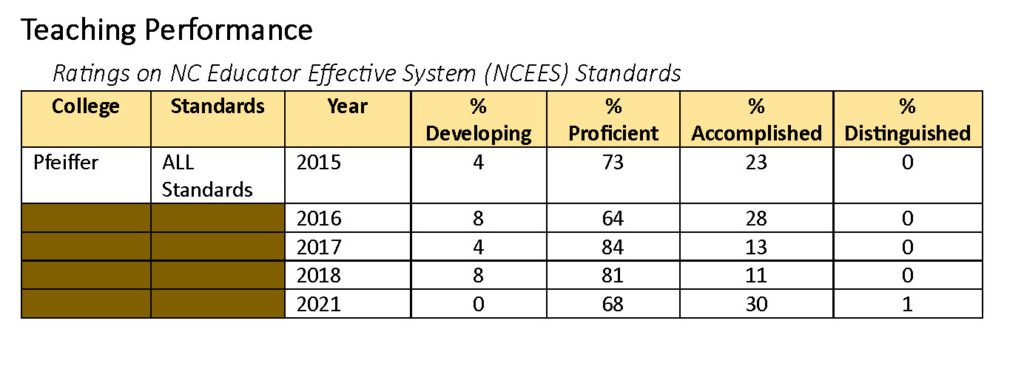
| The North Carolina Department of Public Instruction collects data through the NC Educator Evaluation System for beginning teachers prepared by approved teacher education programs in the state. These observation data are reported on the NCDPI EPP Dashboard annually. (CAEP Reporting Data – for website – 2022-2023) |

Measure 2: Satisfaction of Employers and Stakeholder Involvement (R4.2; R5.3)
| 2.1. Satisfaction of Employers – EPP-created Employer Survey |
|---|
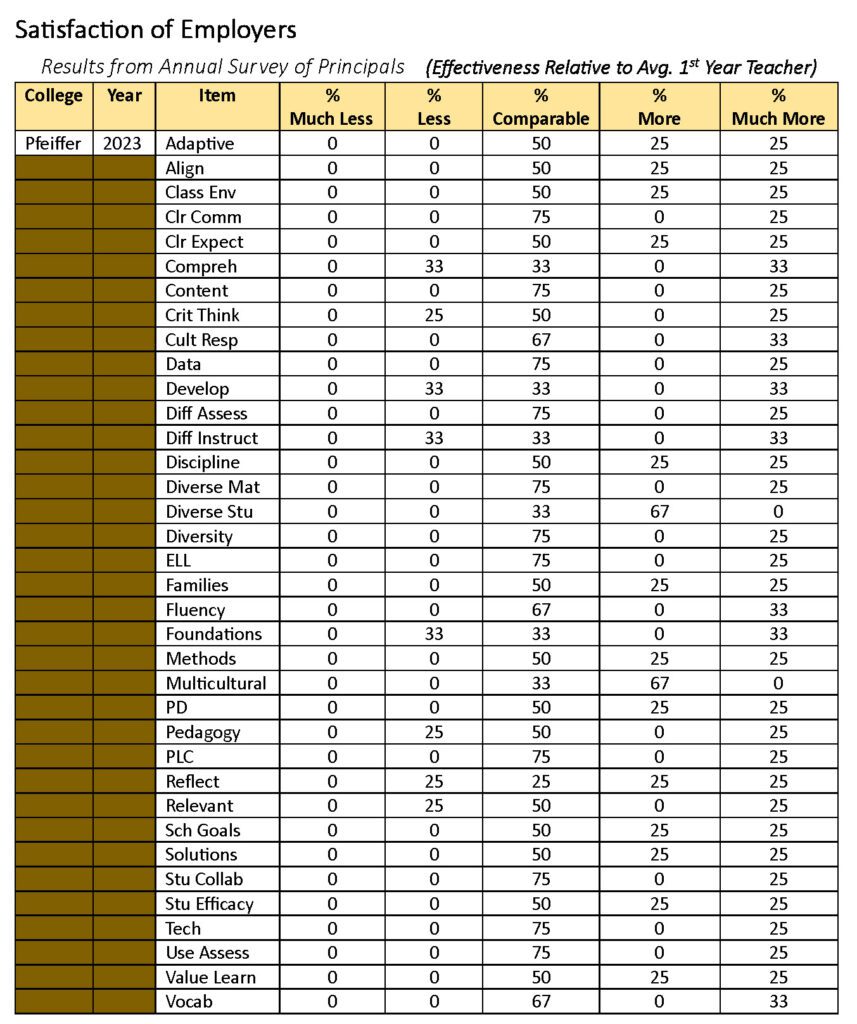
| The North Carolina Department of Public Instruction surveys employers of completers of NC-based EPPs at the conclusion of the first year of teaching, where they are asked to rate completers in comparison to other first-year teachers. These data are reported annually on the NCDPI EPP Dashboard. (CAEP Reporting Data – for website – 2022-2023) |

| 2.2. Description of Stakeholder Involvement |
|---|
| The Partner Advisory Committee (PAC) of the Teacher Education Department at Pfeiffer University is a standing committee made up of professionals in the field and the department faculty. The committee remains active in assisting through advisement on and discussion of current trends in education that will ultimately enhance its curriculum and the educational experience of its teacher candidates. The PAC contributes to advancing and continuously improving the curriculum, policies, and partnership activities. PAC members include practicing teachers in various licensure areas in both elementary and secondary grades, administrators at both elementary and secondary schools, and leaders in curriculum and instruction and digital integration. The Teacher Education program also collaborates with its partners in Stanly County Schools and Montgomery County Schools on its $4.3 million US Department of Education Teacher Quality Partnership Grant, REPERTOIRE. The grant program is designed to recruit, train, place, support, and retain teachers for high-needs fields in rural school districts. The ongoing engagement with these partners helps facilitate the work done in the schools, the University, and in the local community. Clinical placement is another area of partner engagement for the Department of Teacher Education. The Clinical Placement Coordinator works with Human Resources Offices in partner school districts to negotiate partnership agreements, early field placements, clinical/student teaching placements, and ongoing training for mentor and cooperating teachers. Partners assist in the design, implementation, and evaluation of the clinical aspect of the program, providing insights into the didactic components of the program. Pfeiffer is proud of its history of teacher education and its ongoing connections with her alumni who work in the field, particularly in the surrounding region. The wealth of talent from which the Teacher Education Program is able to pull for support of students, its programs, and its initiatives is tremendous. |
Outcome Measures
Measure 3: Candidate Competency at Completion (R3.3)
| 3.1 Licensure Exam Pass Rates |
|---|
| Teacher education candidates sit for a variety of licensure exams, depending on licensure area, prior to being recommended for licensure by the Division of Education. The overall pass rates reflect the ability of candidates to pass all of the exams attributed to their licensure area (Note that some licensure areas have two, three, or even four separate exams that are rolled together into that statistic.). The Division of Education reports overall pass rates and individual exam pass rates to better showcase the actual success of candidates on these exams. |
| Initial Program Licensure Exam Pass Rates | |||||||
|---|---|---|---|---|---|---|---|
| 2022-23 | 2021-22 | 2020-21 | 2019-20 | 2018-19 | 2017-18 | 2014-16 | |
| # Taking Exams | 14 | 6 | 11 | 10 | 12 | 11 | 56 |
| # Passing Exams | 14 | 6 | 11 | 10 | 12 | 10 | 34 |
| Pass Rate | 100% | 100% | 100% | 100% | 100% | 91% | 61% |
In 2014-15, new testing requirements were instituted by the NC Board of Education for candidates pursuing educator licensure. This change included the institution of the Praxis II exam for secondary candidates and the addition of NC Pearson exams for elementary and special education candidates in the areas of General Knowledge: Multi-Subject, General Knowledge: Mathematics, and Foundations of Reading.
| Secondary Programs – Content Knowledge (all programs combined) | |||||||
|---|---|---|---|---|---|---|---|
| 2022-23 | 2021-22 | 2020-21 | 2019-20 | 2018-19 | 2017-18 | 2014-16 | |
| # Taking Exams | 3 | 1 | 1 | 0 | 0 | 3 | 6 |
| # Passing Exams | * | * | – | – | – | * | * |
| Pass Rate | 100% | 100% | 100% | – | – | 78% | * |
| Health and Physical Education – Content Knowledge | |||||||
|---|---|---|---|---|---|---|---|
| 2022-23 | 2021-22 | 2020-21 | 2019-20 | 2018-19 | 2017-18 | 2014-17 | |
| # Taking Exams | 2 | 1 | 0 | 1 | 1 | 3 | 7 |
| # Passing Exams | * | * | – | * | * | 3 | * |
| Pass Rate | 100% | 100% | – | 100% | 100% | 100% | * |
| Special Education – Content Knowledge (Praxis II: Mild to Moderate) | |||||||
|---|---|---|---|---|---|---|---|
| 2022-23 | 2021-22 | 2020-21 | 2019-20 | 2018-19 | 2017-18 | 2014-17 | |
| # Taking Exams | 3 | 1 | 1 | 0 | 0 | 1 | 10 |
| # Passing Exams | * | * | * | – | – | 1 | * |
| Pass Rate | 100% | 100% | 100% | – | – | 100% | 70% |
| Elementary & Special Education – Foundations of Reading | |||||||
|---|---|---|---|---|---|---|---|
| 2022-23 | 2021-22 | 2020-21 | 2019-20 | 2018-19 | 2017-18 | 2014-17 | |
| # Taking Exams | 9 | 5 | 10 | 9 | 11 | 5 | 39 |
| # Passing Exams | 9 | 5 | 10 | 9 | 11 | 5 | 25 |
| Pass Rate | 100% | 100% | 100% | 100% | 100% | 100% | 64% |
| Elementary & Special Education – General Knowledge: Mathematics | |||||||
|---|---|---|---|---|---|---|---|
| 2022-23 | 2021-22 | 2020-21 | 2019-20 | 2018-19 | 2017-18 | 2014-17 | |
| # Taking Exams | 0 | 0 | 0 | 6 | 11 | 5 | 39 |
| # Passing Exams | – | – | – | 6 | 11 | 5 | 24 |
| Pass Rate | – | – | – | 100% | 100% | 100% | 62% |
| Elementary & Special Education – Mathematics – CKT | |||||
|---|---|---|---|---|---|
| 2022-23 | 2021-22 | 2020-21 | 2019-20 | 2018-19 | |
| # Taking Exams | 9 | 5 | 10 | 3 | – |
| # Passing Exams | 9 | 5 | 10 | 3 | – |
| Pass Rate | 100% | 100% | 100% | 100% | – |
| 3.2 Performance Assessment (PPAT) Pass Rates |
|---|
| Teacher education candidates are required to engage in one of the mandated performance assessments approved by the North Carolina Department of Public Instruction to be eligible for endorsement by the EPP for initial licensure. Pfeiffer University’s Department of Teacher Education chose to require the PPAT for its students. This performance assessment is completed as part of the student teaching or final clinical experience for initial licensure candidates in all programs leading to initial licensure (first initial). The Department reports overall pass rates on the assessment as well as mean scores on the assessment by Department and by individual program. |
| Initial Licensure Program Performance Assessment (PPAT) Pass Rates | ||||
|---|---|---|---|---|
| 2022-23 | 2021-22 | 2020-21 | 2019-20 | |
| # Taking Exams | 14 | 6 | 11 | 10 |
| # Passing Exams | 14 | 6 | 11 | 10 |
| Pass Rate | 100% | 100% | 100% | 100% |
Measure 4: Ability of Completers to be Hired in Education Positions for which they were Prepared
| 4.1 Employment Data – Initial Licensure Program Completers | ||||||||
|---|---|---|---|---|---|---|---|---|
| 2022-23 | 2021-22 | 2020-21 | 2019-20 | 2018-19 | 2017-18 | 2016-17 | 2015-16 | |
| # Program Completers | 14 | 6 | 11 | 10 | 11 | 11 | 25 | 13 |
| % Licensed in North Carolina | 100 | 100 | 100 | 100 | 100 | 91 | 64 | 77 |
| % Employed in North Carolina | 93 | 100 | 100 | 90 | 82 | 82 | 80 | 62 |
| % Employed in Education | 100 | 100 | 100 | 90 | 91 | 82 | 88 | 70 |
| % Employed in Other Fields | 0 | 0 | 0 | 0 | 0 | 11 | 4 | 8 |
| % Enrolled in Graduate School | 7 | 0 | 0 | 10 | 9 | 22 | 4 | 8 |
| 4.2 Initial Employment and Retention |
|---|
| The North Carolina Department of Public Instruction publishes, as part of each EPP’s annual dashboard report, data on the percentage of EPP program completers who teach in NC public schools and how long they stay. The data presented below are from the 2021-22 NCDPI EPP Dashboard on Pfeiffer University’s Department of Teacher Education. |
| Data Set on Initial Employment and Retention | Pfeiffer Results 2022-23 Report | State Mean 2022-23 Report |
|---|---|---|
| Initial Teaching License Candidates Entering Teaching in NC (Those employed within three (3) years of program completion, as a percentage of candidates completing programs from 2018-2020.) | 100% | 78% |
| Early-Career Retention (Those teaching at least two (2) years after being employed within three (3) years of program completion, as a percentage of candidates completing programs from 2017-2019.) | 100% | 78% |